PEPE Price Prediction: How High Will the Meme Coin Go?

#PEPE
- Technical indicators show PEPE may be poised for a breakout above its 20-day moving average
- Positive news sentiment and whale accumulation support bullish case
- Key resistance levels to watch: 0.00001187 (20MA) and 0.00001453 (Upper Bollinger Band)
PEPE Price Prediction
PEPE Technical Analysis: Bullish Signals Emerge
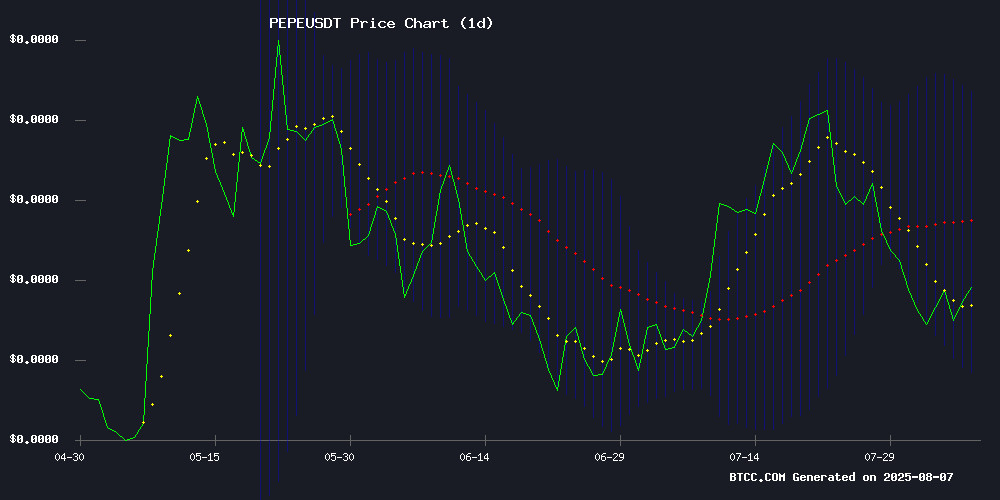
According to BTCC financial analyst William, Pepe is currently trading at 0.00001082 USDT, below its 20-day moving average of 0.00001187. The MACD indicator shows a bullish crossover with the MACD line at 0.00000153 above the signal line at 0.00000086, suggesting potential upward momentum. Bollinger Bands indicate PEPE is near the lower band at 0.00000921, which could act as support. William notes that a break above the middle band at 0.00001187 could signal a stronger bullish trend.
Market Sentiment Turns Bullish for PEPE
BTCC financial analyst William highlights positive market sentiment for PEPE, driven by recent news of whale accumulation and rate-cut expectations. News headlines suggest PEPE could rally up to 40%, with the coin currently consolidating at key support levels. William cautions that while the technicals and news align for a potential uptrend, traders should watch for confirmation above the 20-day MA.
Factors Influencing PEPE's Price
PEPE Jumps 5% Amid Rate-Cut Bets and Whale Accumulation
Pepe, the popular memecoin, surged more than 5% in the past 24 hours, breaking through a key resistance level on high trading volume. The rally reflects sustained buying interest, with volume spikes accompanying each upward move—a signal that larger investors may be accumulating positions.
Despite the technical strength, derivatives activity tells a contrasting story. Trading volume for PEPE contracts has plummeted 73% since mid-July, per CoinGlass data. Meanwhile, the top 100 Ethereum wallets increased their PEPE holdings by 2.36% over the past month, while exchange reserves dropped 2.4%, according to Nansen.
The token's rise aligns with a broader risk-asset rally fueled by expectations of a Federal Reserve rate cut in September. Markets now price a 93% chance of a 25-basis-point reduction, based on the CME's FedWatch tool, while Polymarket traders see a 79% probability.
PEPE Coin Eyes 40% Rally Amid Conflicting Market Signals
PEPE coin's price action paints a contradictory picture, with a 5% daily gain juxtaposed against a 9% weekly decline. The meme coin's 42% annual surge underscores its volatile nature, leaving traders questioning whether current movements signal an impending breakout or a speculative pump-and-dump scenario.
On-chain metrics reveal a potentially bullish trend: exchange reserves have dropped 2.73% this week, with 7 trillion PEPE tokens exiting centralized platforms like Binance and OKX. This migration to self-custody wallets typically reduces immediate sell pressure, creating conditions for potential price appreciation.
The On-Balance Volume indicator suggests a base formation may be underway, though bearish sentiment persists. Market participants remain divided on whether PEPE's exchange outflows represent genuine accumulation or merely a temporary redistribution of tokens.
Pepe Consolidates at Key Support Level Amid Bullish Reversal Signals
Pepe (PEPE) is testing a dynamic support zone that has historically catalyzed strong rallies, with traders watching for confirmation of upward momentum. The meme coin's price action shows consolidation at this critical level after a rejection from the value area high, which stalled its recent advance.
Market structure remains bullish provided support holds, but continuation requires two key factors: a reclaim of the point of control and sustained above-average buying volume. The PEPE/USDT chart on TradingView reveals this inflection point could determine whether the asset retests previous swing highs or faces deeper correction.
Technical analysts note the precision of recent price movements—the value area high rejection occurred exactly at resistance, while the current support zone has triggered multiple rebounds since May. This creates a clear framework for traders: hold above support for bullish setups, break below for potential trend reversal.
How High Will PEPE Price Go?
Based on current technical indicators and market sentiment, BTCC analyst William projects PEPE could test the following levels:
| Resistance Level | Price (USDT) | Potential Gain |
|---|---|---|
| 20-day MA | 0.00001187 | +9.7% |
| Upper Bollinger Band | 0.00001453 | +34.3% |
| News Target | 0.00001515 | +40% |
William notes the 40% rally potential aligns with news headlines, but advises monitoring MACD momentum and volume for confirmation.
